We’re excited to announce the release two new data visualization tools that we have been developing over the winter. These products come from the collaborative volunteer efforts of Reggie Park and Michael Futch. We owe them a huge thank you. Currently, the tools are best suited for desktop computer use. We are working on making them mobile-friendly this summer. The links are accessible from our desktop homepage under the Observations->Avalanches tab on the top menu. Our original avalanche rose, which is mobile-friendly, is still available on the website under the “hamburger” menu.
The first new tool is an avalanche rose with filters. https://cbavalanchecenter.org/avalanche-rose/
Each dot on the rose represents an observed avalanche. Dots are color-coded by a number of user-selected filters, such as avalanche type, trigger, forecast zone, or failure interface. Dots are sized according to the avalanche’s destructive size, and shaded by how recent they are relative to today. Note that the dots are randomly placed within the aspect/elevation octant that the avalanche originated from. Thus, dot placement is not a precise azimuth or altitude, but rather, a general location within the boundaries of that octant. If you mouse hover over each avalanche dot, it will provide additional information and a link to the original observation. Use the time scale slider to filter by date. Another important caveat is that the rose only shows avalanche activity that we observe and document, which is not a comprehensive tally of backcountry avalanches. Our avalanche observations tend to be biased by the terrain that we have better views of or visit more often. For example, we have very good vantages of a lot of east and northeast facing paths from town, such as Climax Chutes, Happy Chutes, and Schuylkill Ridge, whereas we don’t have as many views of northwest or west facing avalanche terrain, such as the west side of the Ruby Range.

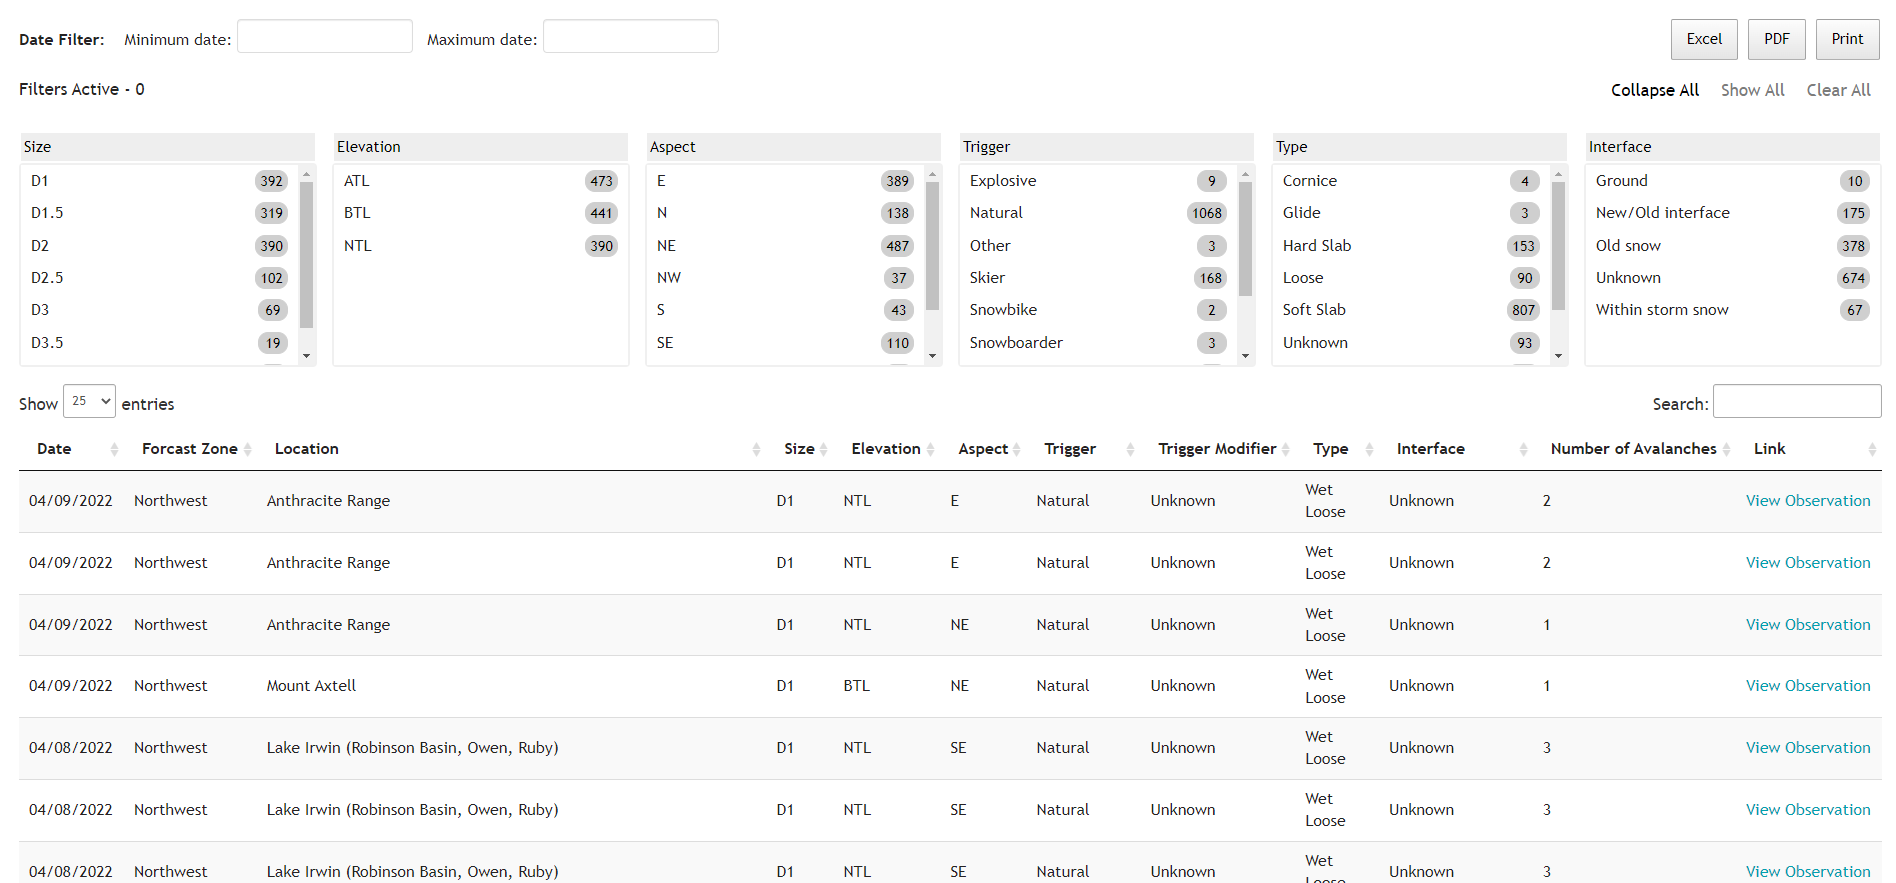
The second tool is our avalanche table. https://data.cbavalanchecenter.org/table.php
The avalanche table allows you to filter, sort, and search for avalanche activity by any number of variables, such as size, elevation, aspect, etc. You can also export your filtered results as a PDF or excel sheet.


